Back to GEMRES Homepage
VisIt Tutorial
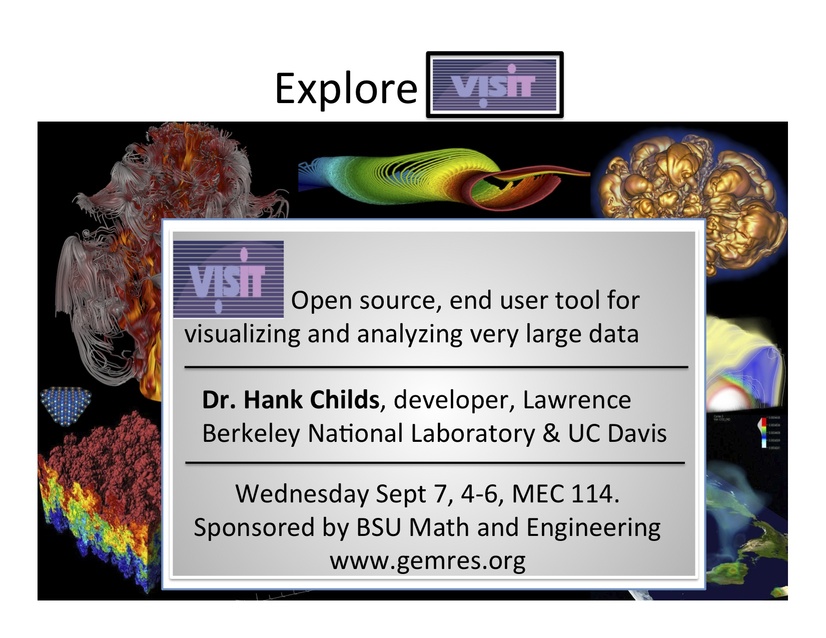
September 7, 2011. 4-6PM, MEC 114 (BSU Campus).
Hank Childs, developer, Lawrence Berkeley Laboratory.
VisIt is a free interactive parallel visualization and graphical analysis tool for viewing scientific data on Unix, Mac, and PC platforms. Users can quickly generate visualizations from their data, animate them through time, manipulate them, and save the resulting images for presentations. VisIt contains a rich set of visualization features so that you can view your data in a variety of ways. It can be used to visualize scalar and vector fields defined on two- and three-dimensional (2D and 3D) structured and unstructured meshes. VisIt was designed to handle very large data set sizes in the tera- to peta-scale range and yet can also handle small data sets in the kilobyte range.
The tutorial primarily consists of a running demonstration of the software. Topics covered will be: basics of using VisIt, quantitative analysis, moviemaking, Python scripting, comparisons, and client/server usage. This demonstration will be augmented with information about how to get started with VisIt, how to get VisIt to read your data, and tips about how to succeed with VisIt after the tutorial.
